|
7.0 (revision 7784de1c)
|
|
7.0 (revision 7784de1c)
|
This document provides an introduction to Score-P: the Scalable Performance Measurement Infrastructure for Parallel Codes. It is a software system that provides a measurement infrastructure for profiling, event trace recording, and online analysis of High Performance Computing (HPC) applications. It has been developed within the framework of the Scalable Infrastructure for the Automated Performance Analysis of Parallel Codes (SILC) project funded by the German Federal Ministry of Education and Research (BMBF) under its HPC programme and the Performance Refactoring of Instrumentation, Measurement, and Analysis Technologies for Petascale Computing (PRIMA) project,funded by the United States Department of Energy (DOE) with the goals of being highly scalable and easy to use.
The partners involved in the development of this system within the SILC and PRIMA projects were:
The goal of Score-P is to simplify the analysis of the behavior of high performance computing software and to allow the developers of such software to find out where and why performance problems arise, where bottlenecks may be expected and where their codes offer room for further improvements with respect to the run time. A number of tools have been around to help in this respect, but typically each of these tools has only handled a certain subset of the questions of interest. A software developer who wanted to have a complete picture of his code therefore was required to use a multitude of programs to obtain the desired information. Most of these utilities work along similar principles. The first step is usually an instrumentation of the code to be investigated. Next, the instrumented programs are executed and write out (often very large amounts of) performance data. These data are then finally graphically displayed and analyzed after the end of the program run. In certain special cases, the visualization and analysis of the program behavior is also done while the program is running.
A crucial problem in the traditional approach used to be the fact that each analysis tool had its own instrumentation system, so the user was commonly forced to repeat the instrumentation procedure if more than one tool was to be employed. In this context, Score-P offers the user a maximum of convenience by providing the Opari2 instrumenter as a common infrastructure for a number of analysis tools like Periscope, Scalasca, Vampir, and Tau that obviates the need for multiple repetitions of the instrumentation and thus substantially reduces the amount of work required. It is open for other tools as well. Moreover, Score-P provides the new Open Trace Format Version 2 (OTF2) for the tracing data and the new CUBE4 profiling data format which allow a better scaling of the tools with respect to both the run time of the process to be analyzed and the number of cores to be used.
Score-P supports the following parallel programming paradigms:
And possible combinations from these including simple serial programs.
In addition, Score-P supports event recording for the following programming interfaces:
This document consists of three parts. This chapter is devoted to a basic introduction to performance analysis in general and the components of the Score-P system in particular. Chapter 'Getting Started' is a beginner's guide to using the Score-P tool suite. It demonstrates the basic steps and commands required to initiate a performance analysis of a parallel application. In the Chapters 'Application Instrumentation', 'Application Sampling', and 'Application Measurement', the reader can find more detailed information about the components of Score-P. Chapter 'Performance Analysis Workflow Using Score-P' provides a typical workflow of performance analysis with Score-P and detailed instructions.
You can subscribe to the news@score-p.org and support@score-p.org by ...
| List Address | Subscription | Posting | Usage |
|---|---|---|---|
| news@score-p.org | open | core team | Important news regarding the Score-P software, e.g., announcements of new releases. |
| support@score-p.org | closed | anyone | Bug reports and general user support for the Score-P software. |
Performance optimization is a process that is usually executed in a work cycle consisting of a number of individual steps as indicated in Figure perf-opt-cycle .
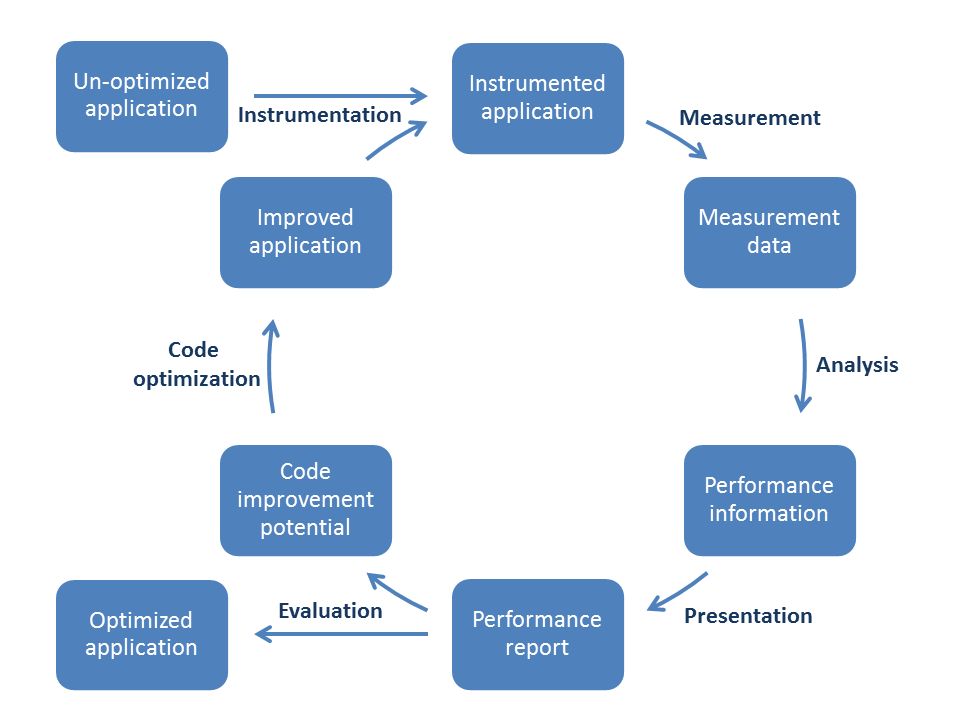
Thus, the process always begins with the original application in its unoptimized state. This application needs to be instrumented, i. e. it must be prepared in order to enable the measurement of the performance properties to take place. There are different ways to do this, including manual instrumentation of the source code by the user, automatic instrumentation by the compiler, or linking against pre-instrumented libraries. All these options are available in Score-P.
When the instrumented application obtained in this way is executed, the additional commands introduced during the instrumentation phase collect the data required to evaluate the performance properties of the code. Depending on the user's requirements, Score-P allows to store these data either as a profile or as event traces. The user must keep in mind here that the execution of the additional instructions of course requires some run time and storage space. Thus the measurement itself has a certain influence of the performance of the instrumented code. Whether the perturbations introduced in this way have a significant effect on the behavior depends on the specific structure of the code to be investigated. In many cases the perturbations will be rather small so that the overall results can be considered to be a realistic approximation of the corresponding properties of the uninstrumented code. However, certain constructions like regions with very small temporal extent that are executed frequently are likely to suffer from significant perturbations. It is therefore advisable not to measure such regions.
The next step is the analysis of the data obtained in the measurement phase. Traditionally this has mainly been done post mortem, i. e. after the execution of the instrumented application has ended. This is of course possible in Score-P too, but Score-P offers the additional option to go into the analysis in the so-called on-line mode, i. e. to investigate the performance data while the application is still running. If the collected data are event traces then a more detailed investigation is possible than in the case of profiles. In particular, one can then also look at more sophisticated dependencies between events happening on different processes.
The optimization cycle then continues with the presentation of the analysis results in a report. Here it is important to eliminate the part of the information that is irrelevant for the code optimization from the measured data. The reduction of the complexity achieved in this way will simplify the evaluation of the data for the user. However, care must be taken in order not to present the results in a too abstract fashion which would hide important facts from the user.
The performance report then allows the user to evaluate the performance of the code. One can then either conclude that the application behaves sufficiently well and exit the optimization cycle with the optimized version of the software being chosen as the final state, or one can proceed to identify weaknesses that need to be addressed and the potential for improvements of the code.
In the latter case, one then continues by changing the source code according to the outcome of the previous step and thus obtains an improved application that then can again be instrumented to become ready for a re-entry into the optimization cycle.
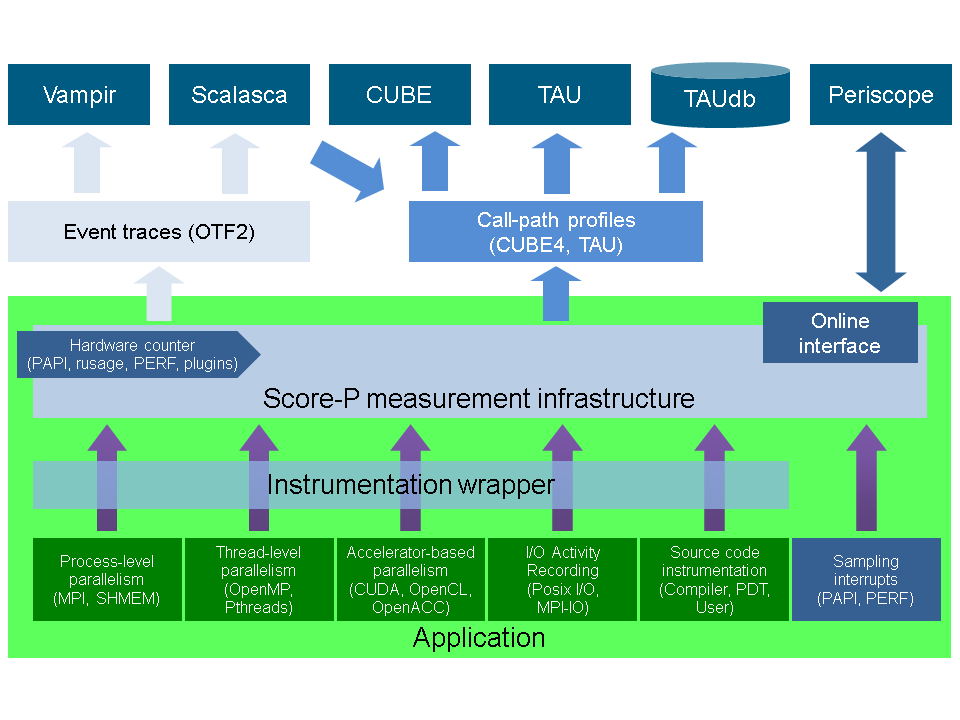
In order to allow the user to perform such an optimization of his code (typically written in Fortran, C, or C++ and implemented in a serial way or using a parallelization via an multi-process, thread-parallel, accelerator-based paradigm, or a combination thereof), the Score-P system provides a number of components that interact with each other and with external tools. A graphical overview of this structure is given in Fig. score-p-overview . We shall now briefly introduce the elements of this structure; more details will be given in the later chapters of this document.
In order to instrument an application, the user needs to recompile the application using the Score-P instrumentation command, which is added as a prefix to the original compile and link command lines. It automatically detects the programming paradigm by parsing the original build instructions and utilizes appropriate and configurable methods of instrumentation. These are currently:
While the first three of these methods are based on using tools provided externally, the Opari2 instrumenter for OpenMP programs is a part of the Score-P infrastructure itself. It is an extension of the well known and frequently used OpenMP Pragma And Region Instrumenter system (Opari) that has been successfully used in the past in combination with tools like Scalasca, VampirTrace and ompP. The fundamental concept of such a system is a source-to-source translation that automatically adds all necessary calls to a runtime measurement library allowing to collect runtime performance data of Fortran, C, or C++ OpenMP applications. This translation is based on the idea of OpenMP pragma/directive rewriting. The key innovation in Opari2, as compared to its predecessor, is the capability to support features introduced in version 3.0 of the OpenMP standard, in particular its new tasking functionality and OpenMP nesting. Opari used to work by automatically wrapping OpenMP constructs like parallel regions with calls to the portable OpenMP monitoring interface POMP. In order to reflect the above-mentioned extensions, this interface also had to be replaced by an enhanced version, POMP2.
Additionally, the user may instrument the code manually with convenient macros provided by Score-P. Score-P also supports sampling functionality that provides an alternative to direct instrumentation.
During measurement, the system records several performance metrics including execution time, communication metrics, and optionally hardware counters. Performance data is stored in appropriately sized chunks of a preallocated memory buffer that are assigned to threads on demand, efficiently utilizing the available memory and avoiding measurement perturbation by flushing the data to disk prematurely.
Without recompilation, measurement runs can switch between tracing and profiling mode. In tracing mode, the performance events are passed to the tracing back-end of Score-P and are written to files for subsequent post mortem analysis using Scalasca or Vampir. This backend uses the newly developed Open Trace Format 2 (OTF2), the joint successor of the Open Trace Format used by Vampir and the Epilog format used by Scalasca. The Score-P system contains a new library with reading and writing routines for OTF2. Basically, OTF2 is a full merge of its two predecessors that retains all their features, and it is planned to become the default data source for future versions of both Vampir and Scalasca. In this way, the user is free to choose between these two complementary tools to investigate the trace files and may select the one that is more appropriate for the specific question at hand. As an alternative to writing the trace data to disk and evaluating them post mortem, it is also possible to directly hand over the data to on-line analysis tools like Periscope. The corresponding interface that allows this on-line access is also an integral part of Score-P.
In profiling mode, the performance events are summarized at runtime separately for each call-path like in Scalasca. Additionally, support for phases, dynamic regions and parameter-based profiling has been integrated. The collected data is passed to the Score-P's profiling back-end CUBE4 for post mortem analysis using Scalasca or TAU or is used directly through the on-line access interface by Periscope. Also in profiling mode, Score-P supports the automatic detection of MPI wait states. Usually such inefficiencies are important bottlenecks and are thoroughly investigated by means of automatic trace analysis and subsequent visual analysis using a time-line representation. In the case of Score-P wait time profiling, inefficiencies are detected immediately when the respective MPI call is completed and stored as an additional metric in the call-path profile. In comparison to earlier versions of CUBE, this new one features a more powerful data model, more flexibility in the specification of system resource hierarchies and display parameters, and various techniques to enhance the efficiency that result in a much better scaling behavior of the analysis tool even in a range of tens of thousands of processes.
As a rough guideline for users who are uncertain which of these two modes to employ, we provide a brief comparison of their main advantages and disadvantages. Specifically, tracing mode allows to retain temporal and spatial connections, and it can reflect the dynamical behavior to an arbitrary precision. Moreover, statistical information and profiles may be derived from the program traces. On the other hand, the amount of data that is produced in the tracing mode can become prohibitively large; profiles tend to require much less storage space. In addition, the additional load that is imposed on the process, and hence the perturbations of the behavior of the code to be analyzed, are much smaller in profiling mode than in tracing mode. And finally we mention that the accurate synchronization of the clocks is an important aspect in tracing mode that may cause difficulties.
The development of Score-P was sponsored by a grant from the German Federal Ministry of Education and Research (Grant No. 01IH08006) within the framework of its High Performance Computing programme and with a grant from the US Department of Energy (Award No. DE-SC0001621). This support is gratefully acknowledged.

