|
7.0 (revision 7784de1c)
|
If an application was instrumented with Score-P, you will get an executable, which you can execute like the uninstrumented application. After the application run, you will find an experiment directory as child of the current working directory, which contains all recorded data (note that there will be no directory if no substrate requested one). The experiment directory has the format scorep-YYYYMMDD_HHMM_XXXXXXXX, where YYYYMMDD and HHMM encodes the date followed by a series of random numbers. You may specify the name of the experiment directory by setting the environment variable SCOREP_EXPERIMENT_DIRECTORY to the desired name of the directory. Note that this directory will also be created directly under the current working directory. No parent directories will be created. If the directory already exists, the existing directory will be renamed by appending a date like above by default. You can let Score-P abort the measurement immediately by setting SCOREP_OVERWRITE_EXPERIMENT_DIRECTORY to false if the experiment directory already exists. This has only an effect if SCOREP_EXPERIMENT_DIRECTORY was set too.
In general, you can record a profile and/or a event trace. Whether a profile and/or a trace is recorded, is specified by the environment variables SCOREP_ENABLE_PROFILING and SCOREP_ENABLE_TRACING. If the value of this variables is zero or false, profiling/tracing is disabled. Otherwise Score-P will record a profile and/or trace. By default, profiling is enabled and tracing is disabled.
You may start with a profiling run, because of its lower space requirements. According to profiling results, you may configure the trace buffer limits, filtering or selective recording for recording traces.
Score-P allows to configure several parameters via environment variables. See Appendix 'Score-P Measurement Configuration' for a detailed description of how to configure the measurement.
Score-P implements a call-tree based profiling system. Every node in the call tree represent a recorded region. The edges of the tree represent the caller-callee relationship: The children of a node are those regions, that are entered/exited within a region. The path from the root to an arbitrary node, represents a call-path. Thus, every node in the tree identifies also the call-path from the root to itself.
Together with a node, the statistics for the call-path are stored. By default, the runtime and the number of visits are recorded. Additionally, hardware counters can be configured and are stored for every call-path. User defined metrics are only stored in those nodes, where the metric was triggered.
For enabling profiling, set the SCOREP_ENABLE_PROFILING environment variable to 1 or true. After the execution of your application you will then find a file, named profile.cubex in your measurement directory, which you can display with the CUBE4 with cube-qt profile.cubex. The name of the profile can be changed through the environment variable SCOREP_PROFILING_BASE_NAME. The extension .cubex will be appended to the base name you specify in the environment variable SCOREP_PROFILING_BASE_NAME.
By default, Score-P writes the profile in CUBE4 base format. Hereby, for every metric contains one value, usually only the sum. However, Score-P allows to store the profile in other formats. To change the default format, set the environment variable SCOREP_PROFILING_FORMAT. Please refer to the description of this variable for possible values.
Score-P records a call tree profile. The maximum call-path depth that is recorded is limited to 30, by default. This avoids extremely large profiles for recursive calls. However, this limit can be changed with the environment variable SCOREP_PROFILING_MAX_CALLPATH_DEPTH.
Parameter-based profiling allows to separate the recoded statistics for a region, depending on the values of one or multiple parameters. In the resulting call-tree, each occurred parameter-value will create a sub-node of the region. Every parameter has a parameter name. Thus, if multiple parameters are used, they can be distinguished and split the call-tree in the order of the parameter events. In the final call-tree it looks like every parameter-name/parameter-value pair is a separate region.
Currently, the only source for parameter events is manual instrumentation (see Section 'Instrumentation for Parameter-Based Profiling').
Phase-profiling allows, to group the execution of the application into logical phases. Score-P records a separate call-tree for every phase in the application. A phase starts when a region of type SCOREP_USER_REGION_TYPE_PHASE (see Section 'Manual Region Instrumentation') is entered. If the region is exited, the phase is left. If two phases are nested, then the outer phase is left, when the inner phase is entered. If the inner phase is exited, the outer phase is re-entered. Figure PhaseProfiling shows the difference in the call-tree if the regions with the names phase1 and phase2 are not of type SCOREP_USER_REGION_TYPE_PHASE on the left side and the forest if they are of type SCOREP_USER_REGION_TYPE_PHASE on the right side.
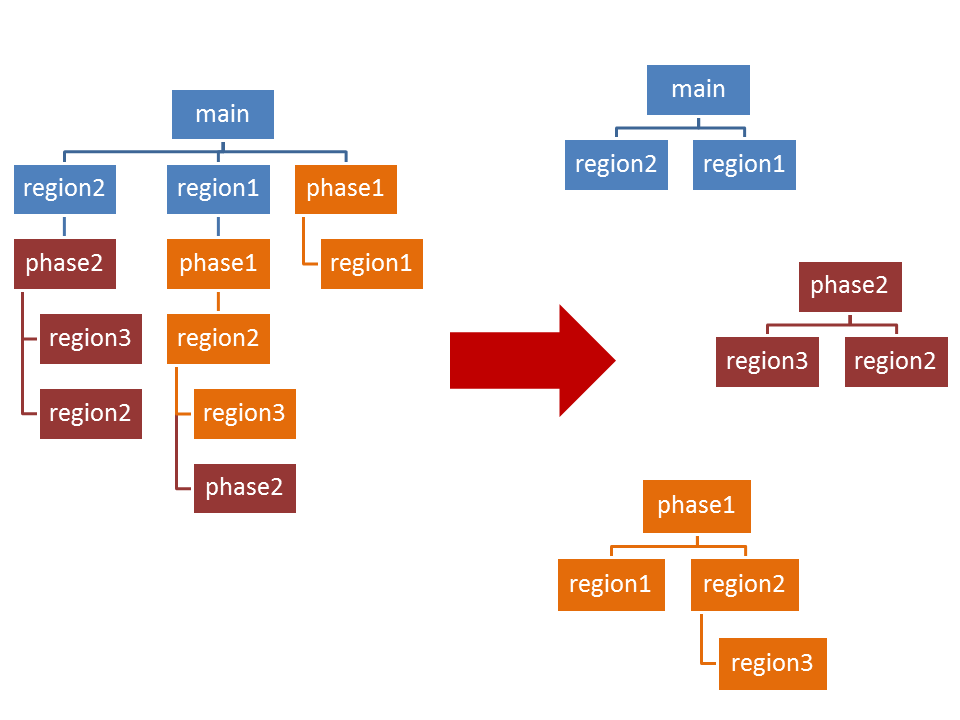
side shows the calltree if no region is of type phase. The right side shows the call-tree forest with phases." If the phase consists of multiple partitions, and thus cannot be enclosed by a single code region, all code-regions that form the phase must have the same region handle. The possibility to define global region handles in C/C++ might be useful for the definition of phases that are have multiple partitions (see Section 'Manual Region Instrumentation').
When profiling, multiple visits of a call-path are summarized. However, e.g, for investigations in time-dependent behavior of an application, each iteration of a main loop (or some other region) should create a separate profile sub-tree. For such cases, Score-P allows to define regions to by of type dynamic. For dynamic regions, each entry of the region will create a separate path. For this cause, the Score-P profiling system creates an extra parameter, named instance. On each visit to a dynamic region, the instance parameter for this call-path is increased and triggered automatically. Thus, the every visit to a dynamic region generates a separate subtree in the profile.
As an example, let us assume that an application contains the regions foo and main, where main calls foo three times. A regular profile would show two call-pathes:
main main/foo If foo is a dynamic region, the profile would contain additional sub-nodes for each visit of foo. The resulting profile would contain the following call-pathes:
main main/foo main/foo/instance=0 main/foo/instance=1 main/foo/instance=2 In this case main/foo contains the summarized statistics for all 3 visits, while main/foo/instance=0 contains the statistics for the first visits of the call-path.
Currently, the only possibility to define dynamic regions is via the manual region instrumentation, described in Section 'Manual Region Instrumentation'.
Clustering allows to reduce the memory requirements of a dynamic region, by clustering similar sub-trees into one cluster. A visualization tool (like CUBE 4) might expand the clusters back to single iterations transparently. You can enable/disable clustering via the environment variable SCOREP_PROFILING_ENABLE_CLUSTERING. By default, clustering is enabled.
Currently, clustering is limited to the instances of one node in the call-tree. If a dynamic region appears on several call-paths, Score-P will only cluster one, and generate separate sub-trees for every iterations in all other call-paths. By default, Score-P will cluster the instances of that dynamic region call-path that it enters first. If you have only one call-path where a dynamic region occurs (e.g., if the body of the main loop is the only dynamic region), this region will be clustered automatically. Otherwise, we recommend to specify the region you want to cluster in the environment variable SCOREP_PROFILING_CLUSTERED_REGION.
Furthermore, the clustered region must not be inside of a parallel region, but must be at a sequential part of the program. However, the clustered region may contain parallel regions.
Clustering is a lossy compression mechanism. The accuracy increases if more clusters are available. On the downside, more clusters require more memory. You can specify the number of clusters you want by setting the environment variable SCOREP_PROFILING_CLUSTER_COUNT to the number of cluster you want to have. The default cluster number is 64.
Furthermore, you can enforce a minimal structural similarity of instances of a cluster. Clusters that fit the minimal structural similarity requirements belong to the same equivalence class. Only instances of the same equivalence class will be clustered together. If you have more equivalence classes than the number of clusters you specified in SCOREP_PROFILING_CLUSTER_COUNT, the maximal number of clusters is increased. Thus, you might get more clusters than you specified.
The minimal structural similarity is defined by the clustering mode which can be set via the environment variable SCOREP_PROFILING_CLUSTERING_MODE. Please refer to the description of this variable for possible values.
If the Score-P profiling system detects inconsistencies during measurement, it stops recording the profile and prints an error message. Examples for reasons of an inconsistent profile are, if the nesting order of function entries and exits is broken, or events appear for an uninitialized thread. This might indicate an bug of the profile, but typically the cause is an erroneous instrumentation. E.g., if manual instrumentation is applied, but not all possible exit points of a function are instrumented.
In order to support debugging of manual instrumentation, or during the development of own automatic instrumentation techniques, the profile can write additional information about its current state in a textual form into a file. This output may contain the following information:
None of the three entries is guaranteed to appear in the output, it depends on the current state of the profile. It might not be possible to provide any output at all. Furthermore, the online representation of the profile structure may differ from the final profile structure.
You can enable this additional output by setting the environment variable SCOREP_PROFILING_ENABLE_CORE_FILES to true. Then, if the profile detects an inconsistency, it will write a core file into your measurement directory. If an inconstant profiles is detected on multiple locations, every location where an inconsistency is detected will write a core file. Thus, it is not recommended, to enable this feature for large scale runs.
Score-P can write events to OTF2 traces. By setting the environment variable SCOREP_ENABLE_TRACING, you can control whether a trace is recorded. If the value is 0 or false no trace is recorded, if the value is non-zero or true, a trace is recorded. If the variable is not specified, Score-P records traces on default. After trace recording you will find the OTF2 anchor file, named trace.otf2 in the experiment directory, along with the trace data.
When automatic compiler instrumentation or automated source code instrumentation with PDT has been used to instrument user-level source-program routines, there are cases where measurement and associated analysis are degraded, e.g., by frequently-executed, small and/or generally uninteresting functions, methods and subroutines.
A measurement filtering capability is therefore only supported for compiler instrumented regions, regions instrumented with the user API from Score-P (see section 'Manual Region Instrumentation'), regions instrumented with the user API from OPARI2 (see section 'Semi-Automatic Instrumentation of POMP2 User Regions'), CUDA device and host activities (see Section 'CUDA Performance Measurement'), and Kokkos activities (see Section 'Kokkos Performance Measurement'). See section 'Selection of MPI Groups' to restrict the recording of MPI features and the OPARI2 documentation of --disable to restrict instrumentation of OpenMP directives. This --disable flag can than be passed on to the OPARI2 invocation with the --opari=<parameter-list> flag of the Score-P instrumenter. Because PDT instrumentation (Section 'Source-Code Instrumentation Using PDT') inserts Score-P user API instrumentation those regions can be filtered, too. Regions can be filtered based on their region name (e.g., their function name) or based on the source file, in which they are defined.
A file that contains the filter definition can be specified via the environment variable SCOREP_FILTERING_FILE. If no filter definition file is specified, all instrumented regions are recorded. For filtered regions, the enter/exit events are not recorded in trace and profile.
The filter definition file can contain two blocks:
When the filter rules are applied, the source file name filter is evaluated first. If a region is filtered because it appears in a filtered source file, it cannot be included by the function name filter. If a region was defined in a not-filtered source file, the region name filter is evaluated. This means, events for a region are not recorded if they are filtered by the source file filter or the region name filter. Events for a region are recorded if the region is neither filtered by the source file filter nor by the region name filter. If one of the both filter blocks is not specified, it is equivalent to an empty filter block.
Beside the two filter blocks, you may use comments in the filter definition file. Comments start with the character '#' and is terminated by a new line. You may use comments also inside the filter blocks. If a region name or source file name contains '#', you must escape it with a backslash.
The filter block for source file names, must be enclosed by SCOREP_FILE_NAMES_BEGIN and SCOREP_FILE_NAMES_END. In between you can specify an arbitrary number of include and exclude rules which are evaluated in sequential order. At the beginning all source files are included. Source files that are excluded after all rules are evaluated, are filtered.
An exclude rule starts with the keyword EXCLUDE followed by one or multiple white-space separated source file names. Respectively, include rules start with INCLUDE followed by one or multiple white-space separated file names. For the specification of file names, bash-like wild-cards are supported. In particular, the '*' wild-card matches an string of arbitrary length, the '?' matches exactly one arbitrary character, or within [] you may specify multiple options.
An example source file filter block could look like this:
SCOREP_FILE_NAMES_BEGIN, SCOREP_FILE_NAMES_END, EXCLUDE, and INCLUDE) are case-sensitive.The filtering is based on the filenames as seen by the measurement system. Depending on instrumentation method and compiler the actual filename may contain the absolute path, a relative path or no path at all. The instrumentation tool tries to create as much absolute paths as possible. Paths are simplified before comparison to a rule. E.g., it removes path/../, /./ and multiple slashes. You may look up the actual filename in the resulting output of the measurement.
The filter block for the region names, must be enclosed by SCOREP_REGION_NAMES_BEGIN and SCOREP_REGION_NAMES_END. In between you can specify an arbitrary number of include and exclude rules which are evaluated in sequential order. At the beginning, all regions are included. Regions that are excluded after all rules are evaluated, are filtered.
An exclude rule starts with the keyword EXCLUDE followed by one or multiple white-space separated region names. Respectively, include rules start with INCLUDE followed by one or multiple white-space separated expressions. For the specification of region names, bash-like wild-cards are supported. In particular, the '*' wild card matches an string of arbitrary length, the '?' matches exactly one arbitrary character, or within [] you may specify multiple options.
An example region filter block could look like this:
In this example, all but the functions bar, foo, baz and main are filtered.
The filtering is based on the region names as seen by the measurement system. Depending on instrumentation method and compiler the actual region name may be mangled, or decorated. Thus, you may want to inspect the profile to determine the name of a region inside the measurement system.
In some cases, the instrumentation provides mangled names, which are demangled by Score-P. In this cases, Score-P uses the demangled form for display in profile and trace definitions, and thus, the demangled form should be used in the filter file. However, The MANGLED keyword marks a filter rule to be applied on the mangled name, if a different mangled name is available. If no mangled name is available, the rule is applied on the displayed name instead. The MANGLED keyword must appear inside of an include rule or exclude rule. All patterns of the rule that follow the MANGLED keyword, are applied to the mangled name, if the mangled name is available.
In the following example, foo and baz are applied to the mangled name, while bar and main are applied on the displayed name.
The displayed name may also be mangled if no demangled form is available. It is not necessary to prepend rules with the MANGLED keyword if the displayed name is mangled, but only if a mangled name is available that differs from the displayed name.
EXCLUDE, INCLUDE, SCOREP_REGION_NAMES_BEGIN, SCOREP_REGION_NAMES_END, and MANGLED are case-sensitive.Score-P experiments record by default all events during the whole execution run. If tracing is enabled the event data will be collected in buffers on each process that must be adequately sized to store events from the entire execution.
Instrumented routines which are executed frequently, while only performing a small amount of work each time they are called, have an undesirable impact on measurement. The measurement overhead for such routines is large in comparison to the execution time of the uninstrumented routine, resulting in measurement dilation. Recording these events requires significant space and analysis takes longer with relatively little improvement in quality. Filtering can be employed during measurement (described in Section 'Filtering') to ignore events from compiler-instrumented routines or user-instrumented routines.
Another possibility is not to record the whole application run. In many cases, only parts of the application are of interest for analysis (e.g., a frequently performed calculation) while other parts are of less interest (e.g., initialization and finalization) for performance analysis. Or the calculation itself shows iterative behavior, where recording of one iteration would be sufficient for analysis. Restricting recording to one or multiple time intervals during measurement would reduce the required space and overhead. This approach is called selective recording.
Score-P provides two possibilities for selective recording.
Switching recording on or off, can result in inconsistent traces or profiles, if not applied with care. Especially, switching recording on/off manually via SCOREP_RECORDING_ON and SCOREP_RECORDING_OFF from the Score-P user instrumentation macros is not recommended. Inconsistent traces may result in errors or deadlocks during analysis, or show unusable data. The consistency is endangered if:
How recording can be controlled through Score-P macros which are inserted in the application's source code, is explained in Section 'Manual Region Instrumentation'. Thus, this section focuses on first possibility, where the user specify recorded regions via a configuration file. Selective recording affects tracing and profiling.
For selective recording, you can specify one or multiple traced regions. The recording is enabled when a recorded region is entered. If the region is exited, recording of events is switched off again. If a recorded region is called inside another recorded region, thus, the recording is already enabled, it will not disable recording of it exits, but recording will be switched off, if all recorded regions are exited.
For recorded regions only regions from Score-P user instrumentation can be selected. If regions from other instrumentation methods are specified in the configuration file for selective recording, they are ignored.
For a recorded region, the recording can be restricted to certain executions of that region. Therefor, the enters for a recorded region are counted, and a particular execution can be specified by the number of its enter. If a recorded region is called recursively, the recording is only switched off, if the exit is reached, that corresponds to the enter that enabled recording.
The configuration file is a simple text file, where every line contains the name of exactly one region. Optionally, a comma-separated list of execution numbers or intervals of execution numbers can be specified. A configuration file could look like follows:
This configuration file would record all executions of foo, the executions 23, 24, 25, 50, 60, 61, and 62 of bar, and the second (numbering starts with 0) execution of baz.
To apply the selective recording configuration file to a measurement run of your application, set the environment variable SCOREP_SELECTIVE_CONFIG_FILE to the configuration file and run your instrumented application. If SCOREP_SELECTIVE_CONFIG_FILE is empty, or the given file cannot be opened, the whole application run will be recorded (no selective recording will apply).
Introducing a long-term event-trace recording mode, the trace buffer rewind feature allows to discard the preceding section of the event trace at certain control points or phase markers. The live decision whether to keep or discard a section can depend on the presence or absence of certain behaviour patterns as well as on similarity or difference with other sections.
Based on user regions (see 'Manual Region Instrumentation'), three macros are given which control the rewind. These are:
The user has to specify whether or not a rewind is requested with a boolean variable in the SCOREP_USER_REWIND_CHECK function. There are two different approaches what to do with the rewind region in the trace based on the boolean variable. If the boolean variable is true, the trace buffer will be reset to an old snapshot and after that rewind region enter and leave events will be written into the trace buffer to mark the presence of the trace buffer rewind. This rewind region then looks like a normal user-defined region in the trace. If the variable is false, than no events of the rewind region are written into the trace, so that the trace buffer looks like the user never instrumented the code w/ rewind regions. Trace buffer flushes have an impact on the rewind regions, i.e. if a flush occurs all previous stored rewind points (which are not "checked", i.e. the flush is in between the region) will be deleted and the SCOREP_USER_REWIND_CHECK function won't write the enter/leave events into the trace independently from the boolean variable. Wrong nested rewind regions are handled as follows:
The check for point 2 would corrupt the trace buffer, so point 2 would be deleted and ignored in the second check.
If Score-P has been built with performance metric support it is capable of recording performance counter information. To request the measurement of certain counters, the user is required to set individual environment variables. The user can leave these environment variables unset to indicate that no counters are requested. Requested counters will be recorded with every enter/exit event.
Score-P provides the possibility to query hardware performance counters and include these metrics into the trace and/or profile. Score-P uses the Performance Application Programming Interface (PAPI) to access hardware performance counters. Recording of PAPI performance counters is enabled by setting the environment variable SCOREP_METRIC_PAPI to a comma-separated list of counter names. Counter names can be any PAPI preset names or PAPI native counter names.
Example:
SCOREP_METRIC_PAPI=PAPI_FP_OPS,PAPI_L2_TCM
This will record the number of floating point instructions and level 2 cache misses. If any of the requested counters is not recognized, program execution will be aborted with an error message. The PAPI utility programs papi_avail and papi_native_avail report information about the counters available on the current platform.
If you want to change the separator used in the list of PAPI counter names, set the environment variable SCOREP_METRIC_PAPI_SEP to the desired character.
SCOREP_METRIC_PAPI_PER_PROCESS for that reason.Besides PAPI, Resource Usage Counters can be recorded. These metrics use the Unix system call getrusage to provide information about consumed resources and operating system events such as user/system time, received signals, and number of page faults. The manual page of getrusage provides a list of resource usage counters. Please note that the availability of specific counters depends on the operating system.
You can enable recording of resource usage counters by setting the SCOREP_METRIC_RUSAGE environment variable. The variable should contain a comma-separated list of counter names.
Example:
SCOREP_METRIC_RUSAGE=ru_utime,ru_stime
This will record the consumed user time and system time. If any of the requested counters is not recognized, program execution will be aborted with an error message.
RUSAGE_THREAD support: yesOtherwise, the information displayed is valid for the whole process. That means, for multi-threaded programs the information is the sum of resources used by all threads in the process.
A shorthand to record all resource usage counters is
SCOREP_METRIC_RUSAGE=all
However, this is not recommended as most operating systems does not support all metrics.
If you want to change the separator used in the list of resource usage metrics, set the environment variable SCOREP_METRIC_RUSAGE_SEP to the desired character.
Example:
SCOREP_METRIC_RUSAGE_SEP=:
This indicates that counter names in the list are separated by colons.
SCOREP_METRIC_RUSAGE_PER_PROCESS for that reason.This metric source uses the Linux Perf Interface to access hardware performance counters. First it is explained how to specify PERF metrics that will be recorded by every location.
You can enable the recording of PERF performance metrics by setting the environment variable SCOREP_METRIC_PERF to a comma-separated list of metric names. Metric names can be any PERF preset names or PAPI native counter names.
Example:
SCOREP_METRIC_PERF=cycles,page-faults,LLC-load-misses
In this example the number of CPU cycles, the number of page faults, and Last Level Cache Load Misses will be recorded. If any of the requested metrics is not recognized program execution will be aborted with an error message. The user can leave the environment variable unset to indicate that no metrics are requested. Use the tool perf list to get a list of available PERF events.
If you want to change the separator used in the list of PERF metrics, set the environment variable SCOREP_METRIC_PERF_SEP to the desired character.
Example:
SCOREP_METRIC_PERF_SEP=:
This indicates that counter names in the list are separated by colons.
SCOREP_METRIC_PERF_PER_PROCESS for that reason.Metric plugins extend the functionality of Score-P by providing additional counters as external libraries. The libraries are loaded when tracing or profiling your application. So there is no need to recompile your application or instrument it manually.
A simple example of a synchronous metric plugin can be found in Appendix 'Score-P Metric Plugin Example'. Every plugin needs to include SCOREP_MetricPlugins.h. The commands to build the corresponding library of this plugin might look like:
To enable a metric plugin, add the plugin <PLUGINNAME> to the environment variable SCOREP_METRIC_PLUGINS and configure the used metrics through the environment variable SCOREP_METRIC_PLUGINNAME. In the following example we want to use the above HelloWorld plugin. We select two counters metric1 and metric2 from the plugin. Make sure that the metric plugin library is placed in a directory which is part of LD_LIBRARY_PATH.
SCOREP_METRIC_PLUGINS=HelloWorld_plugin
SCOREP_METRIC_HELLOWORLD_PLUGIN=metric1,metric2
The Message Passing Interface (MPI) adapter of Score-P supports the tracing of most of MPI's 300+ function calls. MPI defines a so-called 'profiling interface' that supports the provision of wrapper libraries that can easily interposed between the user application and the MPI library calls.
The general Score-P filtering mechanism is not applied to MPI functions. Instead, the user can decide whether event generation is turned on or off for a group of MPI functions, at start time of the application. These groups are the listed sub-modules of this adapter. Each module has a short string token that identifies this group. To activate event generation for a specific group, the user can specify a comma-separated list of tokens in the configuration variable SCOREP_MPI_ENABLE_GROUPS. Additionally, special tokens exist to ease the handling by the user. A complete list of available tokens that can be specified in the runtime configuration is listed below.
| Token | Module |
|---|---|
| ALL | Activate all available modules |
| DEFAULT | Activate the configured default modules of CG, COLL, ENV, IO, P2P, RMA, TOPO, XNONBLOCK. This can be used to easily activate additional modules. |
| CG | Communicators and groups |
| COLL | Collective communication |
| ENV | Environmental management |
| ERR | Error handlers |
| EXT | External interfaces |
| IO | I/O |
| MISC | Miscellaneous |
| P2P | Point-to-point communication |
| RMA | One-sided communication |
| SPAWN | Process management interface (aka Spawn) |
| TOPO | Topology communicators |
| TYPE | MPI Datatypes |
| XNONBLOCK | Extended non-blocking communication events |
| XREQTEST | Test events for tests of uncompleted requests |
Example:
SCOREP_MPI_ENABLE_GROUPS=ENV,P2P
This will enable event generation for environmental management, including MPI_Init and MPI_Finalize, as well as point-to-point communication, but will disable it for all other functions groups.
A shorthand to get event generation for all supported function calls is
SCOREP_MPI_ENABLE_GROUPS=ALL
A shorthand to add a single group, e.g., TYPE, to the configured default is
SCOREP_MPI_ENABLE_GROUPS=DEFAULT,TYPE
A detailed overview of the MPI functions associated with each group can be found in Appendix 'MPI wrapper affiliation'.
A somehow special role plays the XNONBLOCK flag. This flag determines what kind of events are generated by non-blocking peer-to-peer MPI function calls. If XNONBLOCK is not set, an OTF2_MPI_Send event is created at the non-blocking send call and an OTF2_MPI_Recv event is recorded when a non-blocking receive request has completed. If XNONBLOCK is set, an OTF2_Isend event is recorded at the non-blocking send and an OTF2_IsendComplete event when the event was completed. Furthermore, on a non-blocking receive, it records an OTF2_IRecvRequest event. On request completion an OTF2_IRecv event is recorded. In both cases the group P2P must be enabled. Otherwise Score-P records no events for peer-to-peer communication functions.
The measurement system tracks also the names of MPI communicators to easily identify them later in the analysis. This is done via the MPI_Comm_set_name call. But there are some restrictions. First, the name of a communicator is only recorded at the first call to MPI_Comm_set_name for this communicator. Later calls are ignored. Also this call is only honored when the call was made from the rank which is rank 0 in this communicator. Other calls from other ranks are ignored. And lastly the name will also be not recorded if the communicator has only one member.
If Score-P has been built with CUDA support it is capable of recording CUDA API function calls and GPU activities. The measurement is based on NVIDIA's CUDA Profiling and Tool Interface (CUPTI), which is an integral part of the CUDA Toolkit since version 4.1.
Score-P can wrap the NVIDIA compiler (scorep nvcc) to instrument .cu files. If Score-P has been built with the Intel compiler an additional flag has to be added for instrumentation:
--compiler-bindir=<path-to-intel-compiler-command>
Otherwise the program will not be instrumented, as nvcc uses the GNU compiler by default.
Setting the environment variable SCOREP_CUDA_ENABLE to yes enables CUDA measurement. Please refer to the description of this variable to enable a particular combination of CUDA measurement features.
CUPTI uses an extra buffer to store its activity records. If the size of this buffer is too small, Score-P will print a warning about the current buffer size and the number of dropped records. To avoid dropping of records increase the buffer size via the environment variable SCOREP_CUDA_BUFFER (default: 1M).
Since CUDA toolkit version 5.5 the chunk size for the CUPTI activity buffer can be specified via the environment variable SCOREP_CUDA_BUFFER_CHUNK (default: 8k). Buffer chunks are allocated whenever CUPTI requests a buffer (e.g., to record activities on a CUDA stream). SCOREP_CUDA_BUFFER specifies the upper bound of memory to be allocated for CUPTI activities. Therefore it should be a multiple of SCOREP_CUDA_BUFFER_CHUNK.
cudaDeviceReset() or cudaDeviceSynchronize() before the exit of the program. Otherwise GPU activities might be missing in the trace. Previous versions of Score-P allowed users to optionally mitigate this through the flushatexit value in SCOREP_CUDA_ENABLE. This has been inverted; now users who perform this synchronization and would like to see if performance improves by removing a redundant synchronize in Score-P may set dontflushatexit in SCOREP_CUDA_ENABLE instead. flushatexit is deprecated and will be removed in a future version of Score-P.SCOREP_CUDA_BUFFER_CHUNK) gets lost, when the buffer is full. To avoid this issue specify SCOREP_CUDA_BUFFER_CHUNK as large as necessary to store all CUDA device activities until the CUDA device is synchronized with the host. In CUDA 6.0 this issue is fixed and CUPTI does not request buffers for individual streams any more.CUDA support: yesIf not, for most systems it is sufficient to specify the CUDA toolkit directory at Score-P configuration time:
--with-libcudart=<path-to-cuda-toolkit-directory>Otherwise check the configure help output to specify the location of the CUDA toolkit and CUPTI libraries and include files:
../configure --help=recursive | grep -E "(cuda|cupti)"
CUDA device and host activities can be filtered by name at runtime using the Score-P filter file (see Section 'Filtering'). Filtering does not remove CUDA activities inserted by Score-P or CUDA data transfers inserted as RDMA events. If a kernel is filtered, no kernel launch properties activated in SCOREP_CUDA_ENABLE using kernel_counter are inserted for this kernel. GPU idle time is not affected by kernel filtering.
If Score-P has been built with OpenCL support it is capable of recording OpenCL API function calls.
Setting the environment variable SCOREP_OPENCL_ENABLE to yes enables OpenCL measurement. Please refer to the description of this variable to enable a particular combination of OpenCL measurement features.
OpenCL measurement uses an extra buffer to store its activity records. If the size of this buffer is too small, Score-P will print a warning about the current buffer size and the number of dropped records. To avoid dropping of records increase the buffer size via the environment variable SCOREP_OPENCL_BUFFER (default: 1M). Memory in bytes for the OpenCL command queue buffer can be adjusted by setting the environment variable SCOREP_OPENCL_BUFFER_QUEUE (default: 8k).
If Score-P has been built with OpenACC support it is capable of recording OpenACC regions as well as activities such as enqueuing kernels, data uploads, and data downloads. OpenACC activities that are implicitly generated by the compiler are attributed with acc_implicit.
To enable OpenACC measurement in Score-P the user has to:
--enable-shared option when configuring Score-P). ACC_PROFLIB to specify the OpenACC profiling library.export ACC_PROFLIB=<path_to_scorep_installation>/lib/libscorep_adapter_openacc_event.so
SCOREP_OPENACC_ENABLE to yes. Please refer to the description of this variable to enable a particular combination of OpenACC measurement features. OpenACC support: yes
Score-P is capable of recording information from the Kokkos performance portability framework's tools interface, including parallel regions, user regions, memory allocation, and memory copies. As with OpenACC, the user must perform the following steps:
--enable-shared option when configuring Score-P). KOKKOS_PROFILE_LIBRARY to specify the Kokkos profiling library.export KOKKOS_PROFILE_LIBRARY=<path_to_scorep_installation>/lib/libscorep_adapter_kokkos_event.so
SCOREP_KOKKOS_ENABLE to yes. Please refer to the description of this variable to enable a particular combination of Kokkos measurement features. Kokkos events can be filtered by name at runtime using the Score-P filter file (see Section 'Filtering'). This applies to all types of Kokkos events. Users should note that the Kokkos tools interface allows explicit naming of parallel regions, and those names, if provided, will be the names used for filtering.
Online Access (OA) is an interface to the measurement system of Score-P allowing online analysis capable tools to configure and retrieve profile measurements remotely over sockets.
The Online Access interface implements a client-server paradigm, where Score-P acts as a server accepting connections from the remote tool. During the initialization, the OA module of the Score-P creates one socket for each application process. The network addresses and the ports of these sockets are published at the registry service and could be later queried by the remote tool. The hostname and the port of the registry service should be specified via the SCOREP_ONLINEACCESS_REG_HOST and SCOREP_ONLINEACCESS_REG_PORT environment variables, respectively. After publishing the socket addresses and ports, the OA module will accept connections. Once the connection is established the OA module will suspend the application execution and wait for requests. The format of the requests is plain text following the syntax below:
where
BEGINREQUESTS indicates the beginning of the request list, ENDREQUESTS indicates the end of the request list, GLOBAL indicates that the following measurement request is applied to all locations, MPI requests mpi wait states analysis, EXECUTION_TIME requests execution time, METRIC indicates the begin of the metric request, PERISCOPE <periscope_metric_code> requests a metric by the Periscope internal code, PAPI <papi_counter_name> requests a PAPI hardware counter metric by the counter name, PERF <perf_counter_name> requests a PERF hardware counter metric by the counter name, RUSAGE <rusage_counter_name> requests a Resource Usage Counter metric by the counter name, PLUGIN "<metric_plugin_name>" "<plugin_metric_name>" requests a metric supported by the specified metric plugin, OTHER <metric_name> requests a metric, to be defined in Score-P definition system, specified by the name, TERMINATE requests termination of the application, RUNTOSTART requests Score-P to run the beginning of the OA phase, RUNTOEND requests Score-P to run the end of the OA phase, GETSUMMARYDATA requests retrieval of the profile data. When the GETSUMMARY request is received, the OA module will transform the call-path profile into a flat profile and send the data back to the remote tool. The flat profile is sent in two parts, where the first part carries the region definition data and the second part carries profile measurements. Each part starts with the key word MERGED_REGION_DEFINITIONS or FLAT_PROFILE and followed by the number of the entries and the buffer containing the data.
Substrate plugins extend the functionality of Score-P by providing additional backends. The libraries are loaded when your application is started and Score-P is initialized. So there is no need to recompile your application or instrument it manually.
A simple example of a backend can be found in Appendix 'Score-P Substrate Plugin Example'. Every plugin needs to include SCOREP_SubstratePlugins.h and define its name via SCOREP_SUBSTRATE_PLUGIN_ENTRY(<name>). The same name must be used with the prefix scorep_substrate_ as library name. The commands to build the corresponding library of this plugin might look like:
To enable a substrate plugin, add the plugin <PLUGINNAME> to the environment variable SCOREP_SUBSTRATE_PLUGINS. In the following example we want to use the above PrintRegions plugin. Make sure that the substrate plugin library is placed in a directory which is part of LD_LIBRARY_PATH.
SCOREP_SUBSTRATE_PLUGINS=PrintRegions
SCOREP_SUBSTRATE_PLUGINS=foo,bar, the default separator ',' can be changed by setting the environment variable SCOREP_SUBSTRATE_PLUGINS_SEP. SCOREP_SUBSTRATE_<substrate name>_<variable>, e.g., SCOREP_SUBSTRATE_PRINTREGIONS_VERBOSE 
